Table of Contents
Introduction:
We performed these four case studies to highlight the differences between methods to find ground temperature – in accuracy, ease of use, and costs. Then we use these methods in a typical design calculation for a direct-use geothermal (geo-exchange) system to calculate the economic impacts of ground temperature errors on our case studies.
Highlights:
The Umny App can predict ground temperatures with near drill test accuracy, while saving the cost and time of this measurement method.
10x
Compared to the drill test measurement for ground temperature, analytical methods were on average 4°C (7°F) different from reality, whereas the Umny App predictions had an average error of only 0.4°C (0.7°F) – meaning the Umny App was 10X more accurate.
142%
Designing with analytical estimations of ground temperature in these case studies led to an average borehole over sizing of 142%, resulting in excess drilling costs of over $9 K per borehole (at $20/ft) – that’s nearly $1 M in unnecessary capital costs for a 100 borehole system.
4%
The geo-exchange systems designed with the Umny App temperatures were nearly identical in sizing and cost to those designed from drill test measurements of ground temperature, with an average absolute sizing error of just 4% – and average drilling cost estimation error of just $262 per borehole (at $20/ft).
Comparing the 3 Methods to Get Ground Temperature:
There are generally 3 ways to find the temperature below ground. Let’s compare their pros and cons (for a one-minute summary you can watch our video here).
1. Drill Test:
When the test is set up and measured properly, Drill Tests or In-Situ Measurements are usually the most accurate method to find ground temperature. These measurements may be a part of a Thermal Response Test (TRT) and can use a fluid average temperature or even a thermistor string installed in the ground.
Pros:
- They present “ground truth,” the temperature measurements are a direct result of the temperature within the ground, and they are therefore the most accurate representation of reality – so long as they are set up to be measuring this ground temperature and not the temperature interference caused by drilling for the test itself.
Cons:
- These tests are expensive (average of $50K) and time consuming (could be months to book and days to test) and may be unreliable if they haven’t been left to measure the ground temperature undisturbed by the drill testing process.
- Equipment may malfunction leading to data loss or errors in measurement.
- When only measured on one day, they will only capture that moment in the year. This is less of an issue with deeper ground temperatures where seasonal effects are not as prevalent, but in the shallow region (even to 15 m, or 50 ft), the temperatures that are measured only reflect the time when they are measured. Temperatures can shift significantly throughout the year depending on the amount of seasonal change in the climate.
2. Analytical Estimation:
This may be the most common method to find ground temperatures at the start of a project. We are grouping a couple of different methods here, basically any estimation/calculation that relies on the assumption that the ground temperature below a very shallow depth is a constant line equal to the average annual air temperature for that location. Methods could involve the traditional equations using soil thermal diffusivity, which include some variability in the shallow ground for seasonal effects.
Pros:
- If we already know the average annual air temperature for an area, or have done this calculation before because there have been other projects nearby, then this method is quick – simply re-use the temperature assumption from before.
- No on-site drilling is required for this method, meaning it only costs the time that it takes for a designer to find the necessary equation inputs and/or climate data.
Cons:
- This method relies on an assumption (constant annual air temp.) that drill tests are proving to be overly simplified time and time again. In reality, the ground will experience a thermal gradient curve in seemingly every location on earth. As a result, ground temperatures using this method may have significant errors (more on that later).
- Without the equation inputs, this method is impossible. That means that at a minimum, the designer must be able to access good data on the annual air temperature for that location. In Canada, many weather stations are placed quite far from a project site. Another input for the traditional equation is the soil’s thermal diffusivity (“alpha”), which requires detailed knowledge of the soil lithology and thermal conductivity to calculate properly. A designer must spend costly hours finding this information, or rely on a generalized value for this that in many cases is as good as guessing.
3. Umny App (ML Predictive Model):
This method uses a massive database of quality assured drill test results, along with other geological and environmental measurements to recognize patterns in the physics that determine what the ground temperature will be. Using machine learning, this algorithm can predict the temperature in a new location based on what it has learned from historical drilling and geoscience.
Pros:
- This method is extremely fast and easy-to-use: results can be generated in minutes by just selecting a project’s location. Designers can get started right away with our results presented as raw data, in °C and °F, as a linearly interpolated average by depth, and with seasonal temperature profiles as well.
- This method is the most accurate method before drilling: since it was built with a mass of real-world data, this tool has learned the complexity of thermal gradients underground, and can predict in most locations on earth with a standard error of just +/-0.8°C (1.4°F) from a real measured value. Read more about our validation here.
- No sensors or drilling are required, the Umny App is fully virtual.
Cons:
None! Are you kidding? This is the Umny blog after all 😉. But of course, the current version (v1.5) of the Umny predictor for ground temperature has some limitations that a drill test method will not, such as:
- It is not built to be accurate in areas with extreme ground temperatures (such as above a volcano or in the coldest parts of the arctic). It is also unable to account for significant anomalies such as the ways a recent construction project, human activity, or massive water flow may be influencing the ground temperature. Read more about our inaccuracy zones here.
- For now, we have limited the app to work down to 200 m, whereas, if you have the time and money to keep drilling, a drill test could get you results much farther (but stay tuned as we also reach deeper).
Comparing Their Temperature Results in 4 Locations:
So, let’s see these methods in action. We selected four case study locations across Canada, USA, and Switzerland (and we have tested many more on our accuracy page).
These case studies had real temperature profiles measured by depth in a drill test that we can consider to be the “actual” ground temperatures in each of these regions. We call these the “Measured” results and plot these temperatures by depth in blue.
Next, we selected climate station data from the closest available source and took an annual average of the air temperature. In the case of Hastings Lake, we also calculated the ground temperature using the traditional equation with soil thermal diffusivity. You can see these results for the analytical method in the red dashed line (“Climate Station”) or solid line (“Calculation”).
Finally, we selected the exact coordinates of each of these studies on the Umny App. Our ML algorithm then predicted the temperature by depth, which is plot in green.
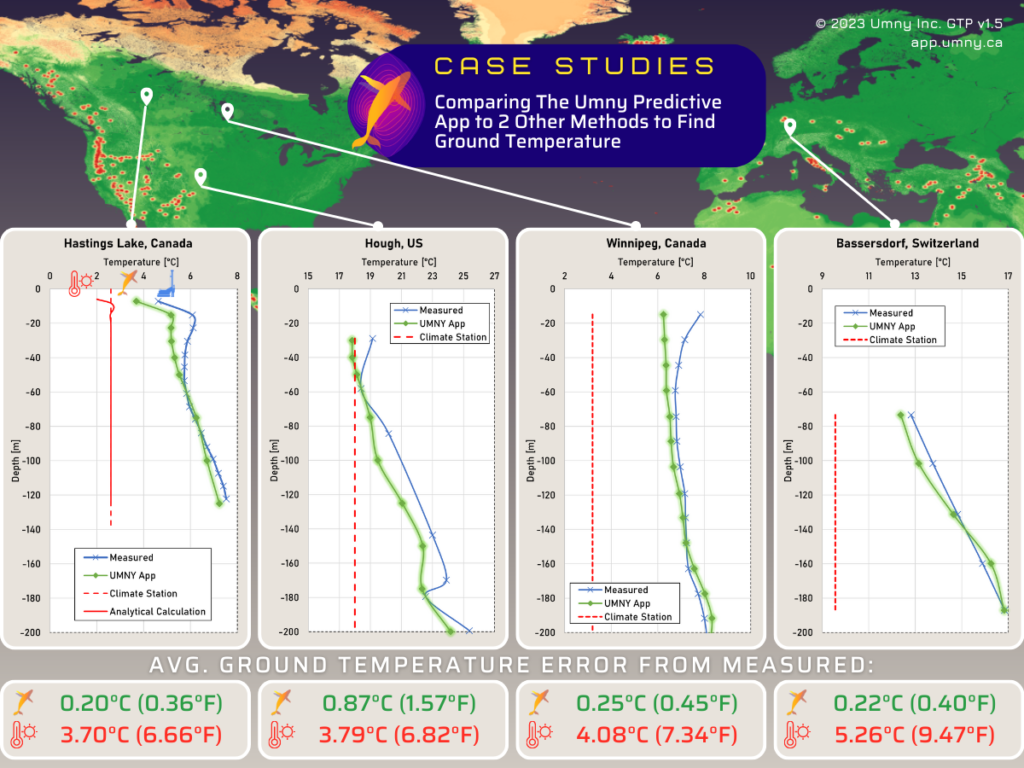
Figure 1: Ground Temperature Profiles by Method
You will notice that the drill test measured ground temperatures are not constant in any of these case studies but have a thermal gradient that is highly location dependent.
Across all these results, it is also obvious that the analytical air temperature method does not match what the drill tests found, and these errors tended to become larger the deeper into the ground we go. For each of these case studies, the average annual air temperature was colder than the actual measured drill tests (this may not always be the case). Even with the traditional equation that includes seasonal variation, the results were not similar to drill tests because they were still tied to the mean air temperature.
Moving to the green lines, look at how similar they are to reality! Honestly, we at Umny are always so happy running these comparisons (send us drill tests if you’d like to compare our app with your own data for free). It is just amazing that the power of machine learning can get us closer to “modelling nature’s complexity” (our original slogan). The Umny App predicts the various thermal gradient curves in each of the locations, and is nearly exactly the value of the drill test measurements in our highest accuracy depths of 30-175 m.
Taking an average ground temperature by depth for each of the three methods, we calculated the “ground temperature error” to be equal to the absolute value of:
Avg. Ground Temp. by Analytical or by Umny App – Avg. Ground Temp. by Drill Test
Table 1: Ground Temperature Error by Method
| Hastings Lake, Canada | Hough, USA | Winnipeg, Canada | Bassersdorf, Switzerland | |
| Umny App Error: | 0.20°C (0.36°F) | 0.87°C (1.57°F) | 0.25°C (0.45°F) | 0.22°C (0.40°F) |
| Analytical Method Error: | 3.70°C (6.66°F) | 3.79°C (6.82°F) | 4.08°C (7.34°F) | 5.26°C (9.47°F) |
Across these four case studies, the average ground temperature error by the Analytical Method was 4.2°C (7.6°F) compared to the average ground temperature error by the Umny app of just 0.39°C (0.70°F)!
Effects of These Temperatures on Geothermal (Geo-Exchange) Design:
What do these ground temperatures mean for direct-use geothermal (geo-exchange, or ground-source heat pump) systems?
To design a geo-exchange system, a designer can use a variety of software (including CFD), or analytical calculations to determine how much heating and cooling they could generate from a particular site. These results are extremely sensitive to the ground properties that the designer inputs to their design tool. Read more about this in our blog series here.
Using a tool like the Umny App can lower drilling costs without changing any of the traditional hardware or drilling methods.
For our case studies we used the ASHRAE standard equations to design the length of a typical u-loop vertical in-ground heat exchanger (called a “borehole” here). For a fair comparison, we kept every single variable in the equation constant, except for the average undisturbed ground temperature. For those, we used the values found by each of the three methods above.
Sizing the Borehole:
The resulting length of the borehole (“sizing”) is dependent on how much heating or cooling we ask the system to provide.
For example, the average ground temperature in Hastings Lake using the analytical calculation was quite cold (2.6°C) compared to the Umny App (6.1°C) or Drill Test (6.3°C) temperatures. If we were designing a system that was cooling dominant, the analytical calculation would say that there is more cooling potential in the ground than either the Umny App or Drill Tests said, and so the analytical calculation might result in “under sizing” of the borehole (shorter than what it actually needs to be). In contrast, if we were asking for a heating dominant system, the analytical calculation would likely say that we needed to drill far deeper than reality (“over sizing”), because it assumes that the ground temperature is much colder (less heating potential) than the drill tests actually showed it to be.
We used a balanced building load in our case studies, meaning we asked the system to provide exactly the same amount of heating and cooling over exactly the same amount of days.
The graph below shows the required borehole lengths for each location to meet the same building load using the same system conditions – based on the average ground temperature by method. The error in sizing (calculated as the percentage increase in length by the analytical method compared to the drill test method) is also shown:
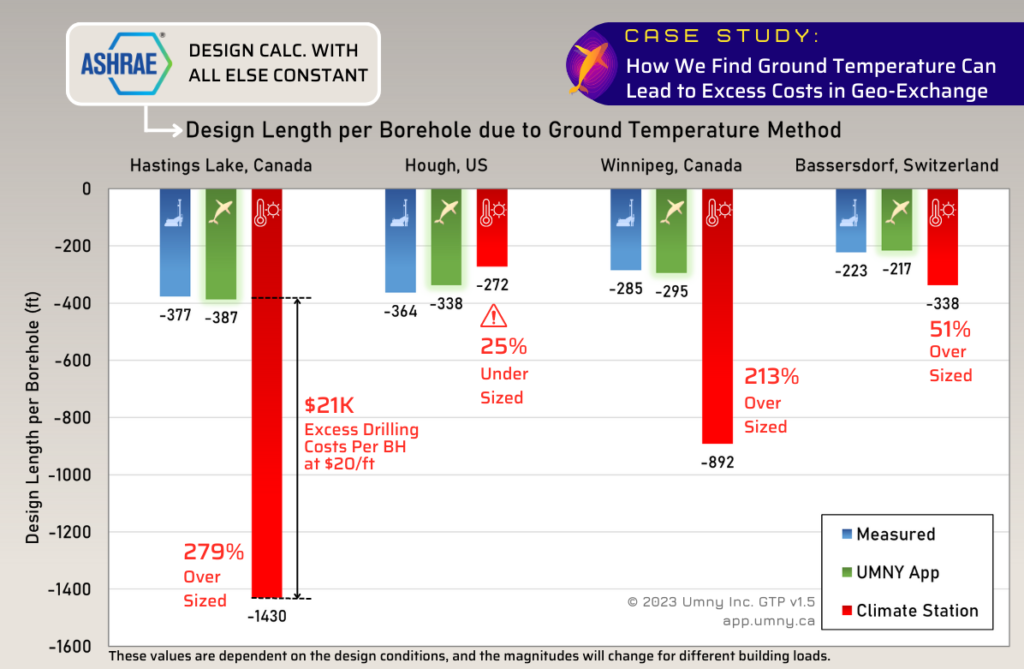
Figure 2: Required Borehole Length due to Ground Temperature Method
The Umny App sized the borehole lengths to be nearly the same as the drill test results. This means that using the Umny App in the early stages will help to result in a design (and a budget) that is close to reality.
This is not the case for the analytical method, where the systems were significantly over sized in Canada due to the far colder annual air temperature than actual ground temperature for these sites. In Hough, Ohio, the system designed from the Climate Station was 25% under sized because the ground is actually hotter than expected (meaning it has less cooling potential in reality) – this could result in the failure of the system, an overreliance on backup systems, or an eventual ground temperature creep that reduces the effectiveness of the geo-exchange system to the point of system failure.
The design length error was calculated as the absolute value of:
Design Length by Analytical or Umny App – Design Length by Drill Test
Table 2: Design Length Error by Method
| Hastings Lake, Canada | Hough, USA | Winnipeg, Canada | Bassersdorf, Switzerland | |
| Umny App Error: | 3 m (10 ft) | 8 m (26 ft) | 3 m (10 ft) | 2 m (7 ft) |
| Analytical Method Error: | 321 m (1053 ft) | 28 m (92 ft) | 185 m (607 ft) | 35 m (115 ft) |
Across these four case studies, the average design length error by the Analytical Method was 142 m (466 ft) compared to the average design length error by the Umny app of just 4 m (13 ft)!
Drilling and Capital Costs:
These differences in design length are directly related to the overall costs of the geo-exchange system. This is because drilling is typically priced on a per-foot basis: the deeper you need to drill, the higher the upfront costs will be. Many technologies are focused on reducing these costs, but it is also important to recognize that improving the accuracy of design practices by using a tool like the Umny App can lower drilling costs without changing any of the traditional hardware or drilling methods.
Using a conservative $20/ft of drilling (we’ve heard it can be as high as USD $75/ft), the economic effects of the ground temperature methods in our case studies become even more apparent. In Alberta, where the oversizing was 279%, the cost to drill each borehole would be $21 K more than what is actually needed!
Drilling cost errors are calculated as the absolute value of:
Drilling Cost by Analytical or Umny App – Drilling Cost by Drill Test
These costs will scale as the project scales, because they are magnified by the number of boreholes required. The following table shows the resulting cost to drill two boreholes for a residential scale system to the different design lengths given by each ground temperature method:
Table 3: Drilling Costs – Residential System
| Ground Temp. Method: | Hastings Lake, Canada | Hough, USA | Winnipeg, Canada | Bassersdorf, Switzerland |
| Drill Test: | $15 K | $11 K | $9 K | $15 K |
| Umny App: | $15 K | $12 K | $9 K | $14 K |
| Analytical: | $57 K | $36 K | $14 K | $11 K |
Using the analytical method in these case studies could result in an average absolute drilling cost estimation error of $18.7 K, compared to the Umny App average absolute drilling cost error of just $525. Quoting homeowners in Hastings Lake a geothermal drilling cost of $57 K compared to the $15 K that might actually be needed will no doubt change how many people adopt geo-exchange systems. For residential clients, having this much change on the budget sheet could go or no-go an entire project!
The following graph shows this impact in a commercial scale with 100 boreholes drilled at $20/ft:
Table 4: Drilling Costs – Commercial System
| Ground Temp. Method: | Hastings Lake, Canada | Hough, USA | Winnipeg, Canada | Bassersdorf, Switzerland |
| Drill Test: | $755 K | $571 K | $446 K | $728 K |
| Umny App: | $774 K | $591 K | $433 K | $676 K |
| Analytical: | $2,861 K | $1,785 K | $676 K | $545 K |
At this commercial scale, the average absolute drilling cost error from the analytical method climbs to $933 K, while the Umny App is jut $26 K different from what the drill test results would require. Again, imagine how much easier it might be in Hastings Lake to approve a geothermal project with drill costs under $1 M, compared to almost $3 M!
The magnitudes of these effects vary with the type of building load that the system must supply, and the ground temperature that it is at. But these case studies highlight the real economic impact that ground temperature errors can have for geothermal systems, impacts that could be significant enough to get a project approved or not.
For systems that are under sized, the extra costs will come to those that inherit the geo-exchange system – either by way of needing to power up backup equipment more often, pay to mitigate ground temperature creep, or by excess electricity costs from a heat pump not running within its optimal efficiency range.
And finally, the capital costs that the Umny App saves are from the method to find the ground temperature itself. Drill tests can cost on average $50 K per test, and the analytical method could take several hours of a designer’s consulting budget. The Umny App is a more economical method to find ground temperature (view current pricing), even when you don’t consider the larger project costs that result from the improvements in accuracy and sizing.
Summary:
The method that we use to find ground temperature will determine the accuracy of that ground temperature. And this accuracy can have significant implications for projects that rely on calculations where this temperature is an input (such as the geo-exchange system example shown here).
The Umny App was specifically built to solve the need for better ground data before drilling. It models the complexity of the ground, without requiring the time and cost of setting up sensors or performing manual calculations.
In these case studies, our Umny predictions were 0.2 – 0.9°C (0.4 – 1.6°F) different from the drill test measurements, leading to geo-exchange borehole design lengths that were within an absolute average of 4 m (13 ft) of what would be needed in reality. This means that the Umny App helped to avoid excess drilling and estimated average absolute drilling costs per borehole to within $262 (at $20/ft) of what the drill test would predict – all without having to pay for a drill test or sensor measurement.
In contrast, using the average annual air temperature method resulted in ground temperatures that were 3.7 – 5.3°C (6.7 – 9.5°F) different from reality, which could lead to an average absolute drilling cost error of over $9 K per borehole (at $20/ft).
While the magnitude of the economic costs will change depending on the building loads, these case studies show that geo-exchange systems are highly sensitive to the accuracy of the ground data that we design them with.
For your next project, ask yourself:
How much will the design and budget change if my ground temperature is 4 – 5°C (7 – 10°F) hotter or colder in reality?
Check out our tutorial video on how to use the Umny App to find ground thermal properties below and sign up today for a full thermal report on us.