Part 3 In the Series:
Overlooked Essentials in Geothermal Energy
TABLE OF CONTENTS
Introduction
What are ρ, Cp, and k?
Impact on Geothermal (Geo-Exchange) Performance
2 Realistic Examples
Test #1: Five Years of a Cooling Dominant Load on 140 Boreholes
Test #2: Three Years of a Cooling Dominant Load on 13 Boreholes
Comparing the Difference Between These 2 Soils
Long-Term Effects
Short-Term Effects
Understanding the Complex Relationship Between Properties and Performance
How to Get ρ, Cp, and k Values for Your Soil/Ground
How to Use ρ, Cp, and k Values to Predict Geothermal Performance
Key Findings:
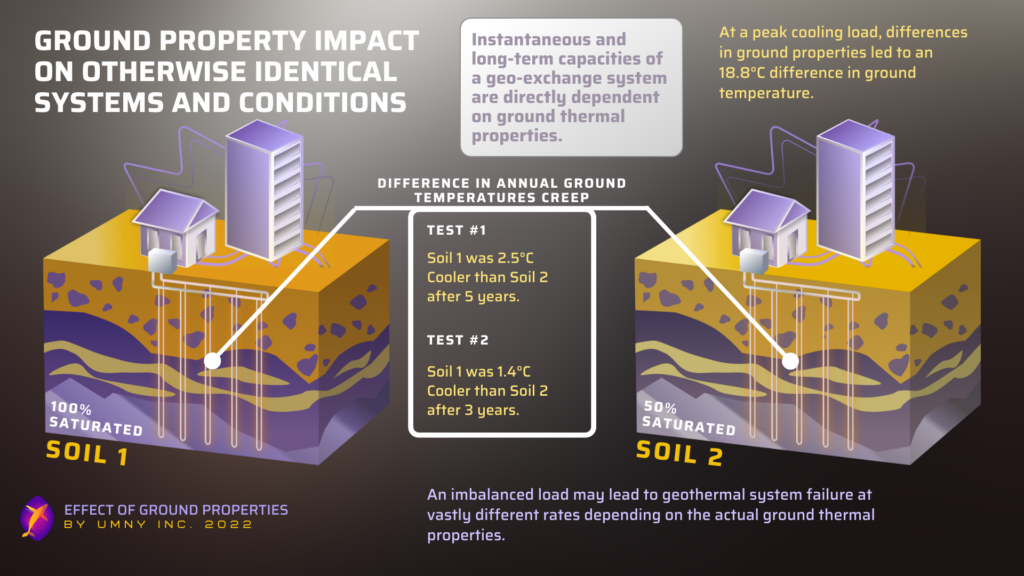
The way soils react to the heat exchange of a geothermal or geo-exchange system is completely dependent on ground thermal properties. In two extremely different soils, the exact same thermal load can result in ground temperatures around the borehole that are more than 18°C different!
In our realistic tests, we showed that two soils with slightly different soil properties (resulting from changes to their saturation %), will experience completely different ground temperature increases over time. After just five years, our soil with 50% saturation was 2.5°C warmer than the fully saturated soil.
This means that the longevity (and long-term performance and environmental impact) of a geo system can only be known if accurate soil thermal properties are known. These essential variables cannot be oversimplified in the design stage.
It also means that the effects from our previous blog posts (Part 1 and Part 2) for this 5-year example are even more amplified:
1,000 MWh
ANNUAL ENERGY THAT MAY BE LOST OR GAINED
$250,000
ANNUAL ENERGY COST THAT MAY BE LOST OR SAVED
200,000 kg
ANNUAL AMOUNT OF CO2 THAT MAY BE EMITTED
Introduction:
This is our third article in our series highlighting the importance of high accuracy when predicting, designing, or managing geothermal systems. In this article, we are going to be making our first two articles even more relevant by showing one of the most common causes of discrepancies in geothermal heat exchange system (GHE) performance.
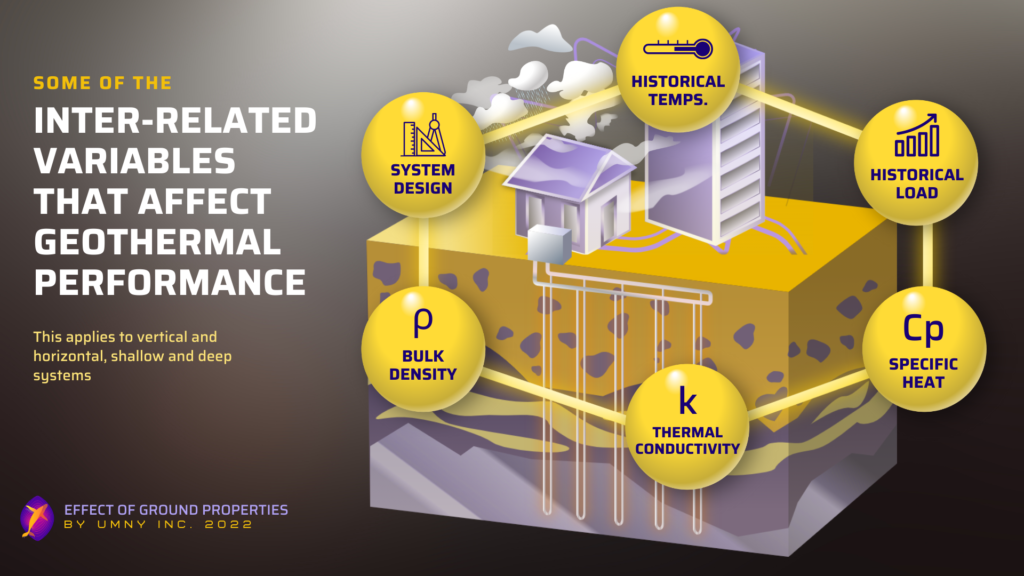
Specifically, we are going to be looking at the thermal properties of the ground. Whether your system is in soil, bedrock, or any other material, there are three main properties which determine how much heat energy (hot or cold) can be transferred through the material and how much can be stored inside the material:
- Density (ρ)
- Specific Heat (Cp)
- Thermal Conductivity (k)
*Collectively referred to as “ρ, Cp, and k” from now on.
What effects can small differences in ground ρ, Cp, and k values have on a geothermal system’s short- and long-term performance?
The purpose of this blog post is to demonstrate how different ground conditions can greatly affect not just a geo-heat exchange system capacity but also its long-term efficiency after years of operation. Even identical system designs can vary significantly in terms of performance and profitability if they are located in areas with different ground properties.
The reason why ground-sourced heating/cooling is generally more efficient than air-sourced heating/cooling is because the ground is able absorb and dissipate a given load of heating/cooling energy better than air, and therefore it is able to provide more consistent and favorable temperature ranges for the heat pump or heat exchanger. This difference in ability between air and ground is primarily due to the differences between the ρ, Cp, and k values of the two substances.
As we will demonstrate in this blog post, the ground thermo-physical properties and temperature play significant roles in the short- and long-term performance of shallow geothermal energy applications. These ground properties are highly variable and can change based on location, depth and season. This change can have a dramatic effect on a geo-exchange system operation and capacity.
What are ρ, Cp, and k?
Relation to Ground Physical Properties:
Only ρ (Density) corresponds directly to the physical structure of a soil or rock. Cp and k are properties derived from the combination of different elements, densities, etc. of the soil or rock.
ρ: Bulk Density (g/cm3)
Bulk Density is a direct physical property, and includes the moisture in the soil (not Dry Bulk Density).
Cp: Specific Heat (J/kgK)
Specific Heat is primarily dependent on the temperature of the ground and the water content, but is also affected by things like soil texture, rock type, and carbon content.
k: Thermal Conductivity (W/mK)
Thermal Conductivity is a very complex variable, dependent on almost every physical property of the ground. There is no exact formula for determining this property from the physical components of the ground (although we have developed a machine learning tool that is able to predict this property very accurately for soil, using only the soil’s physical properties).
Ranges in Nature:
Realistic ranges for these values, as informed by research such as the Geological Survey by the United States Department of the Interior are shown in the following table:
| Realistic Ranges | ρ (g/cm3) | Cp (J/kg∙K) | k (W/m∙K) |
| Lowest Realistic | 0.2 | 600 | 0.1 |
| Common Range | 0.7 – 2.2 | 800 – 2500 | 0.5 – 3.5 |
| Highest Realistic | 3 | 3500 | 4.5 |
As you can see, there are quite a large range of possible values for ρ, Cp, and k. Especially when you consider that in our testing, we have found that very small changes (such as a change from a ρ of 0.8 to a ρ of 0.85) in even one of these values can have a dramatic impact on ground thermal behavior, depending on what the other two properties are.
Impact on Geothermal (Geo-Exchange) Performance:
Because there is no existing empirical data that is sufficient to characterize the performance of Geothermal Systems based on the ρ, Cp, and k values of the ground they are situated in, we have used CFD modelling to demonstrate the relationship. Although real-world measurements are usually the gold standard in terms of data, CFD modelling (if it is built properly, and validated against real world data) can produce valuable insights in situations, like this one, where real-world data does not exist and/or would be extremely expensive to acquire.
Differences in ρ, Cp, and k can lead to ground temperature differences of over 18°C/K in magnitude.
As part of our research, we have studied a wide range of combinations of soil properties that are experiencing the same inputs (building load from the geo system for example). The following figure is an example of this data, where each line corresponds to a different ρ, Cp, and k combination. The soil temperatures just beside the borehole over a year are wildly different, even though all of these tests use the same cooling dominant load.
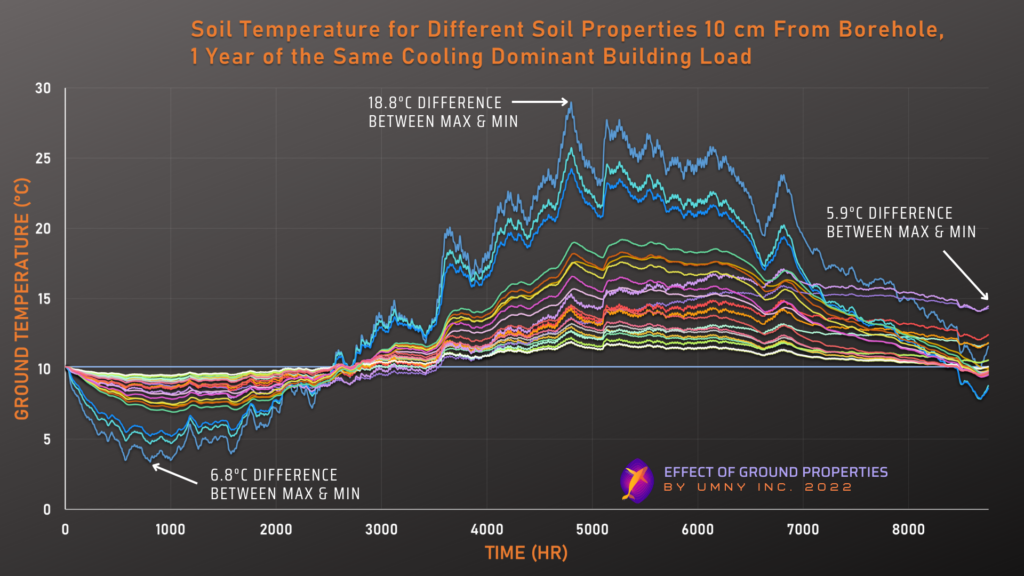
This data demonstrates the massive impact that ρ, Cp, and k can have on ground temperature, and therefore geothermal performance (as we explained in Part 2).
All parameters between each of the data series displayed in this chart (including the thermal energy being put into/removed from the ground by the geothermal system) are exactly the same except for the ρ, Cp, and k of the simulated ground. You can see that in the short-term, differences in ρ, Cp, and k can lead to ground temperature differences of over 18°C/K in magnitude and in the long-term the differences become more and more pronounced.
2 Realistic Examples:
Many of the data series from the chart above represent extreme ρ, Cp, and k combinations which are unlikely to be found in practice, so to demonstrate the effects of ρ, Cp, and k on geothermal systems more practically, let’s look at the difference between two real soils.
Both of these soils have the same exact texture (mostly sand, very low carbon, very low coarse particles). The only difference between these soils is that Soil 1 is 100% saturated and Soil 2 is only 50% saturated (“saturation” here meaning the volumetric percentage of pore space that is filled with water). This difference in saturation means that there are slight differences between ρ, Cp, and k as quantified in the following table:
| Thermal Property | Soil 1 (100% Saturated) | Soil 2 (50% Saturated) |
| Density, 𝜌 (kg/m3) | 1798 | 1549 |
| Specific Heat, Cp (J/kg∙K) | 1256 | 1666 |
| Thermal Conductivity, k (W/m∙K) | 1.8 | 1.623 |
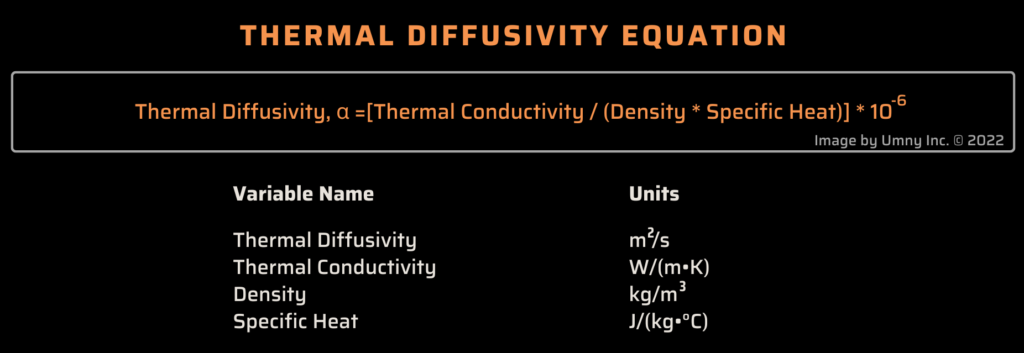
| Thermal Diffusivity, α (m2/s) | 0.6 | 0.83 |
A difference like this is very likely in the real world. It can easily happen in the geothermal pre-installation/design phase if estimates of soil properties are off, or if a rule-of-thumb estimate is used in place of more accurate ρ, Cp, and k estimation methods.
Likewise, even after a geothermal system is installed there are many things which can change the typical moisture in the ground, such as changing drainage patterns due to construction activities, changing groundwater due to up-hill land-use changes, and even the geothermal system itself can change ground moisture content by changing the temperature of the ground.
We want to emphasize that in this example we are only looking at a difference in soil moisture, for simplicity’s sake, but any change in the ground physical properties (changes in temperature, changes in carbon content, compaction, etc.) will affect its ρ, Cp, and k.
We will show the raw data for two test scenarios and then discuss what it means.
Test #1: Five Years of a Cooling Dominant Load on 140 Boreholes
The first test uses a grid of 140 in-ground heat exchangers (a.k.a boreholes) that are 100 m in length, and are not grouted. These boreholes are each subjected to a cooling dominant load (meaning there is more cooling energy being drawn from the system over the year than there is heating energy) for five years.
Test 1: Ground Heat Exchanger (GHE) System Specs
| Ground Heat Exchanger Depth | 100 m |
| Total Number of Boreholes | 140 |
| Separation Between Boreholes (Grid) | 5.3 m |
Test 1: Annual GHE Load Summary – Cooling Dominant Case
| Total GHE Heating Load | -1,309 MWh/yr |
| Total GHE Cooling Load | 3,847 MWh/yr |
| Total Heating Time | 3,999 hrs/yr |
| Total Cooling Time | 4,761 hrs/yr |
| Imbalance Ratio (Total Cooling Load/ Total Heating Load) | 2.94 |
| Excess Heat Rejected to Ground | 5,156 MWh/yr |
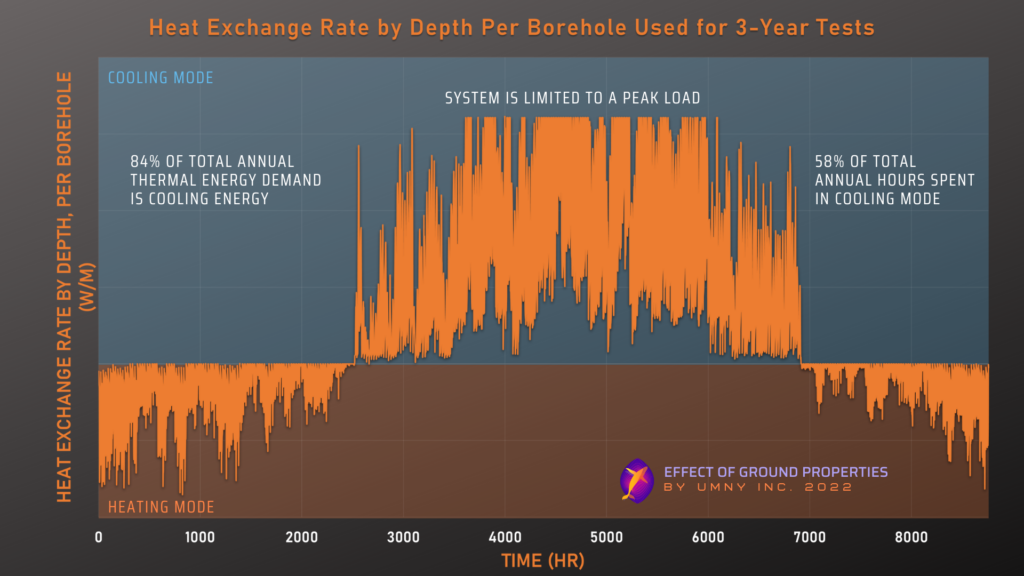
This load is applied as an hourly value across the year, shown in the graph below as a heat exchange rate by depth. This is the converted building load, through the GSHP, that reflects the value of heat exchange between the borehole and the surrounding ground, per meter of depth, and per borehole in the grid. Positive values refer to cooling, and negative are heating.
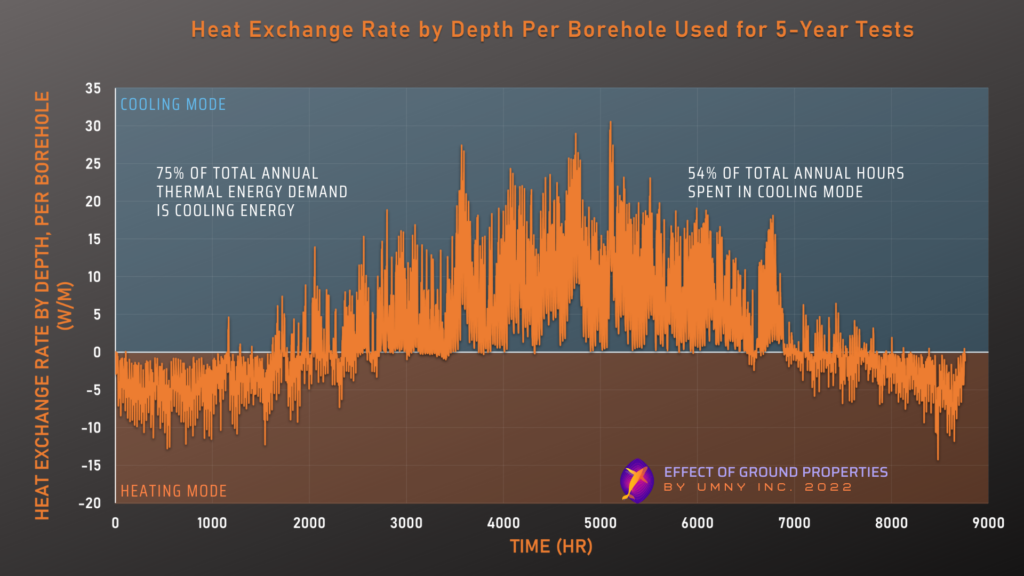
The obvious imbalance of the cooling demand shown in the chart above will typically result in a “ground temperature creep” over time. We expect that because the system puts in more heat to the ground than it takes out, this will lead to the ground becoming warmer every year.
The next figure shows this temperature creep, but highlights the differences to this trend that occur because of slight differences in the ground’s thermal properties. These temperatures are measured halfway down the vertical length of the borehole, at a distance of 10 cm away.
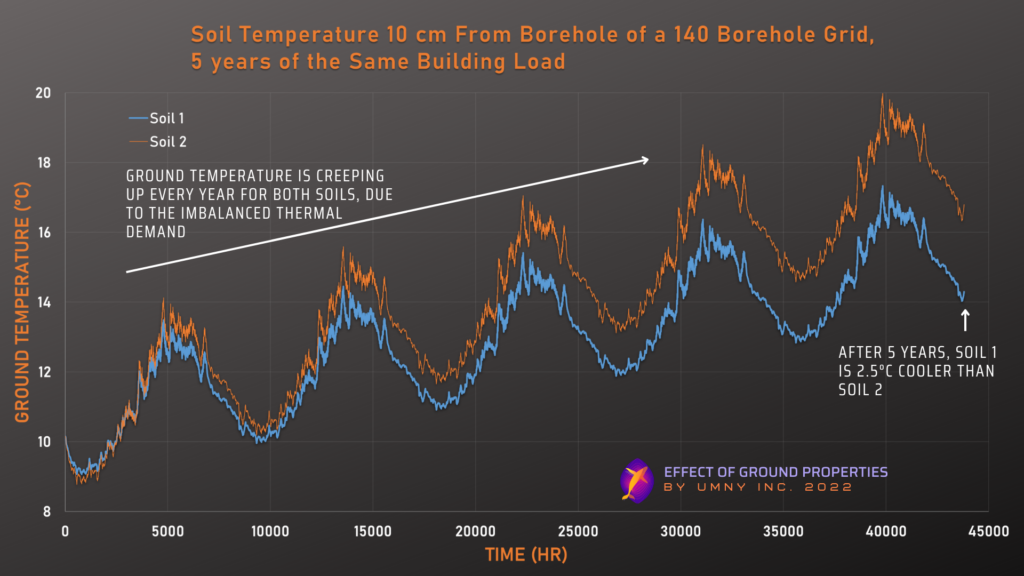
Measuring the difference in this ground temperature creep between the two soils, it is clear that they increase in temperature at very different rates – with the largest divergence between them happening at the 5-year mark (and expected to continue to increase without intervention).
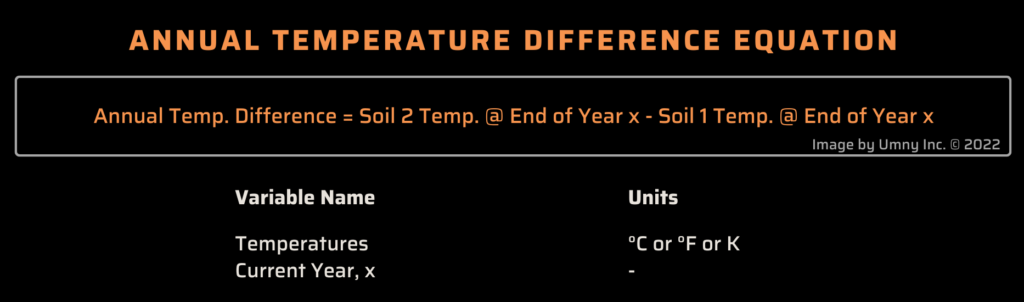
| Year | Annual Ground Temp. Difference |
| 1 | 0.48°C |
| 2 | 0.99°C |
| 3 | 1.5°C |
| 4 | 2.0°C |
| 5 | 2.5°C |
Test #2: Three Years of a Cooling Dominant Load on 13 Boreholes
Similar to Test 1, this test also uses a cooling dominant load (something that is becoming more and more common in buildings around the world), to show the differences in how Soil 1 and Soil 2 react to these conditions over 3 years. This system of 114 m deep grouted boreholes is arranged in a line.
Test 2: Ground Heat Exchanger (GHE) System Specs
| Ground Heat Exchanger Depth | 114 m |
| Total Number of Boreholes | 13 |
| Separation Between Boreholes (Line) | 4.572 m |
Test 2: Annual GHE Load Summary – Cooling Dominant Case
| Total GHE Heating Load | -28,385 MWh/yr |
| Total GHE Cooling Load | 148,164 MWh/yr |
| Total Heating Time | 3,150 hrs/yr |
| Total Cooling Time | 4,390 hrs/yr |
| Imbalance Ratio (Total Cooling Load/ Total Heating Load) | 5.2 |
| Excess Heat Rejected to Ground | 119,779 MWh/yr |
This system’s heat exchange rate by depth per borehole is shown in the following graph, where this test includes a peak capacity limit, which the load cannot exceed.
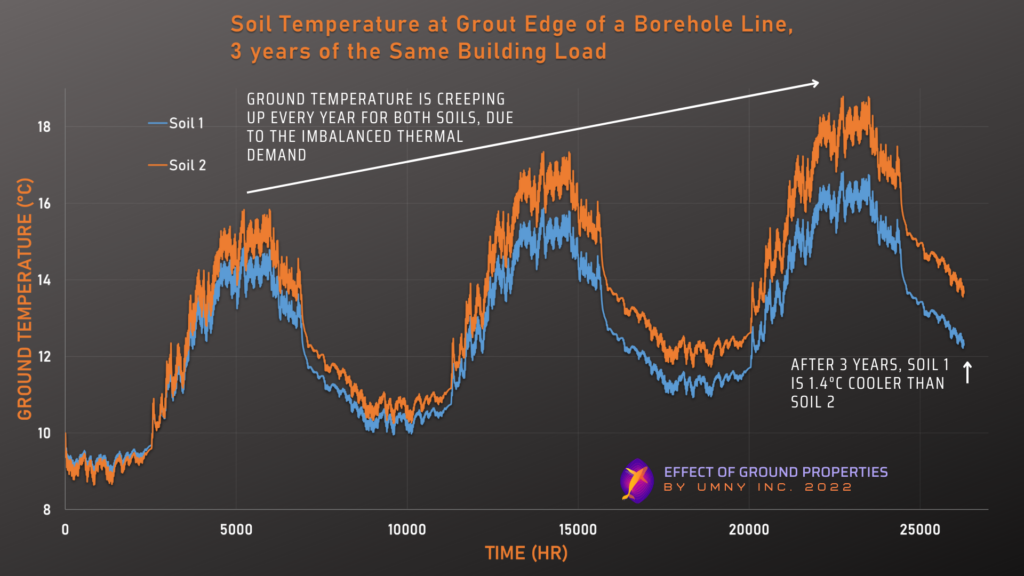
Comparing the trend of ground temperature creep between Soil 1 and Soil 2, the following figures show the ground temperature at two points in the grid (both are at a depth of half the borehole vertical length). The first figure measures the changes of temperature happening in the middle of the line of boreholes. This point is further away than the next figure which measures the temperature beside the borehole, at the interface of the grout and the soil.
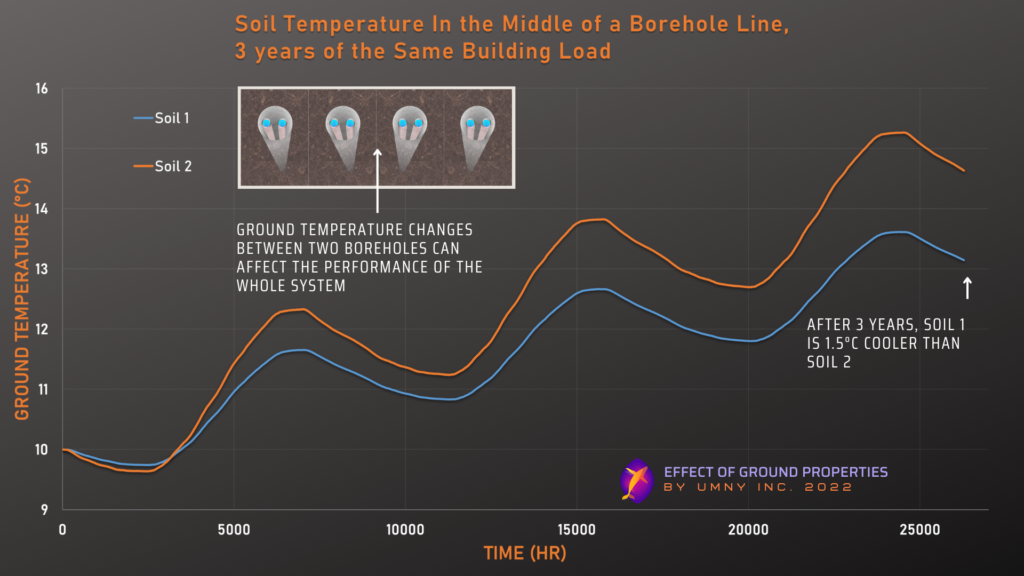
Poorly designed geothermal systems can, and have, become unusable after just a few decades, or even just a few years, because of gradual changes in the ground temperature due to imbalances in the load the geothermal system is handling.
Comparing the Differences Between These Two Soils:
Both of the cooling dominant tests we ran above show that there are distinct differences in the ground temperature trends between Soil 1 and Soil 2 in both the long-term and the short-term.
Long-Term Effects:
Geothermal heat exchange systems cease to function if ground temperatures move beyond a certain range. This is a major problem in the industry, as poorly designed systems can, and have, become unusable after just a few decades, or even just a few years, because of gradual changes in the ground temperature due to imbalances in the load the geothermal system is handling.
The ρ, Cp, and k values of the ground around the geothermal system are some of the primary factors in determining how the ground will respond long term, which is one of the main reasons that understanding ρ, Cp, and k is so important.
In the comparison of the two realistic soils above, we show how the soil temperature will change over the long-term much more for Soil 2 (50% saturated) than for Soil 1 (100% saturated).
What happens if a system is designed in a soil with a different saturation than in reality?
If a system was designed with Soil 1 in mind, a simple discrepancy of an additional 50% of soil saturation above what was expected (either due to errors in the initial ground analysis or due to changes in the ground that occur after installation), could lead to an unexpected gradual change in the ground temperatures of 0.4°C (Test #1) to 0.5°C (Test #2) each year. This change is on top of the existing ground temperature creep from an imbalanced load.
In 10 years, this simple error could lead to ground temperatures being 5°C worse than expected, which, as we showed in Part 2, represents potentially massive losses in system performance, dollars and GHG emissions. In this scenario, the system will become less efficient each year and eventually the ground temperatures will have changed so much that the system stops functioning.
This is an example with relatively minor differences in ρ, Cp, and k values. In the real world, we frequently see designers using regional rule-of-thumb ground property values which can be much farther from the real situation than the difference between Soil 1 and Soil 2 in our example above!
Short-Term Effects:
The graphs above demonstrate clearly (especially if you look at the peaks of each year) that ρ, Cp, and k not only affect the long-term temperatures of the ground; they also determine the way that the ground responds to the shorter-term changes in load applied by the geothermal system.
For example, in our half-saturated soil (Soil 2), the energy being exchanged with the ground (which is the exact same between both soil types) is not dissipated as quickly as it is in the fully saturated soil. Meaning that during the cooling season (when heat is being dumped into the ground), the ground temperatures around the borehole increase more and more quickly, leading to generally higher ground temperatures over the course of a given cooling season (and vice-versa with the heating season). Higher ground temperatures during the cooling season (or lower during the heating season) mean that the system with Soil 2 is less efficient, even in the first year, than the system with Soil 1 (see Part 2 to understand more about the relationship between ground temperatures and system efficiency).
However, based on our in-house testing, there are some situations in which a ground that tends to perform worse over many years, can still sometimes perform better in the short term due to its unique combination of ρ, Cp, and k. As we have mentioned, the relationship between these three variables and geothermal heat exchange is very complex!
Note:
Normally it is assumed that grounds with a higher “thermal diffusivity” are better for geothermal systems, however in these two examples we can see that, for these two realistic soils, the opposite is true. Soil 2 has a higher “thermal diffusivity” (0.83 m2/s) than Soil 1 (0.6 m2/s, but performs worse in the short and long term.
Understanding the Complex Relationship Between Properties and Performance:
Through our extensive and exhaustive CFD modelling we have found that there is no simple equation that can accurately describe the thermal behavior of a ground or a geothermal system based on given ρ, Cp, and k values. You cannot say, for example, that for a given ρ and Cp combination changing k linearly will result in linear changes in Geothermal system behavior. Especially when you consider the reality that these values change with temperature and season.
Our testing shows that even a seemingly simple scenario, like estimating the annual change in ground temperatures for a single design of geothermal system, is a problem with at least 10 independent variables (or it is a 10+ dimensional feature space, to use machine learning terminology).
Some of the key variables involved in predicting long-term and short-term geothermal performance:
This complexity means that accurate predictions of a geo-system’s performance in the short and long term can only be achieved currently with either custom CFD models built very carefully in combination with highly accurate ground property measurements, or with the use of machine learning (our company uses both of these methods). And even with an accurate initial design, the possibility of unexpected changes in ground properties after installation means that active monitoring and control systems to keep ground temperatures within optimal, or at least functional, ranges (which we also offer) are also necessary in many cases.
How to Get ρ, Cp, and k Values for Your Soil/Ground:
After discovering the importance of these variables, and realizing how understudied they are in regards to Geothermal, we have been working on building tools to assist the geothermal industry in tackling this complexity. We believe that if geo-exchange designers are able to accurately determine a site’s ρ, Cp, and k values, and understand what those mean for geothermal system performance, the industry will be able to massively increase profitability, efficiency, and longevity.
So how can you determine the ρ, Cp, and k for a selected site? The key issue is acquiring both Wet Density (ρ) and Dry Density (Bulk Density) values for the site (and they must be highly accurate). You can use these, along with easily obtained texture (sand, silt, clay), moisture content, and rock content readings to determine ρ, Cp, and k in the following way:
- ρ = Wet Density, which you already have.
- Cp = Specific heat of each ground component (ex. sand, rock) TIMES the relative mass fraction of that component. You can use our free online calculator to get this value.
- k = In the absence of direct k measurements with specialized instruments the most accurate method, by far, is to use our Machine Learning tool, SoK, which was specifically developed for this task. If you are dealing with bedrock, you can use standard values based on the exact type of rock you are dealing with, since rock is not as variable as soil. However, for porous rocks you will have to determine some method for accounting for the moisture content, which has a significant effect on k.
These values can be relatively easily obtained for rock (using core samples), however things get more complicated when a significant portion of the geothermal system will be in contact with soil not rock.
When dealing with soil, traditional geotechnical study methods are not usually able to provide ρ, Cp, and k values with sufficient accuracy for the depth of a geothermal pile. The results of a geotechnical study can be used to assist with some of the ρ, Cp, and k calculations (as described below), however the all-important density measurements cannot be accurately determined from a geotechnical borehole due to sample disturbance (and there are no accurate conversions between SPT/CPT values and density).
There are currently no cost-effective solutions for accurately determining ρ, Cp, and k in soil at depths below a few meters.
Accurate wet/dry density measurements can be achieved at shallow depths because soil samples can be extracted without disturbance to the volume of the sample (using methods from the agricultural industry, for example). But what about situations with soil that goes below a few meters in depth, how can Wet Density and Dry Density be determined in these situations?
- Use radiation-based sensors lowered down boreholes (ex. Neutron Probe) to determine the overall density (Wet Density) of the ground and the water content, and then calculate the Dry Density from the combination of these (you can use Umny Soil for this calculation).
- Use a progressive excavation technique where standard shallow-type sampling techniques can be used at depth.
Unfortunately, as you can see, there are currently no cost-effective solutions (the two above solutions are extremely expensive) for accurately determining ρ, Cp, and k in soil at depths below a few meters.
For this reason, given how important this is for the future of the geothermal industry, we are in the process of developing a geothermal-specific method for determining the ρ, Cp, and k of a site directly using just a single borehole and no expensive or hazardous radiation-based sensors (we are currently looking for funding and partners for this project). When this project is done it will be the cheapest and most reliable method for determining the thermal behavior of the ground directly.
How to Use ρ, Cp, and k Values to Predict Geothermal Performance:
There are currently no accurate tools nor algorithms that we are aware of for predicting either long-term or short-term geothermal behavior/performance based on a given ρ, Cp, and k combination, aside from custom CFD models.
And, as we explain above, the relationship is extremely complicated, and is not something that can be guessed at or determined by simple rules of thumb. To address this lack, we are in the process of developing Machine Learning based tools to predict the various important aspects of geothermal performance (for example, how much the temperature of a geothermal system changes in the long-term due to an imbalanced load, given a certain ρ, Cp, and k). This tool will eliminate the current need for costly and time-consuming custom CFD models in many situations (we are also currently looking for funding for this project).
Conclusion
For the Geothermal Industry to reach its true potential we must give ρ, Cp, and k the attention they are due.
Identical geothermal systems can behave extremely differently in the long-term, depending on the exact ρ, Cp, and k values of the ground the pile is situated in. Small discrepancies in estimated vs actual ρ, Cp, and k values can lead to geothermal systems that are significantly less efficient, or more efficient, than they were designed to be. This can lead to geothermal systems that fail far sooner than expected, due to the ground going above or below the operating range of the system.
Knowing these properties exactly is the only way for geothermal system designers to build a system of the correct size for the design requirements. Lacking this knowledge, designers are forced to greatly oversize the system (reducing profitability) or else risk premature system failure. For the Geothermal Industry to reach its true potential we must give ρ, Cp, and k the attention they are due.
Tools for quickly and cheaply determining these ground properties (such as the ones we are developing/have developed) also allow system designers/installers to evaluate potential sites to determine the profitability of a geothermal system at each site. This is because ground types with better thermal performance characteristics can take a more extreme load without going out of balance, meaning a geothermal system can be built with fewer geothermal heat exchangers, less space between boreholes, or with shallower piles, without compromising its performance – even in the long-term. In other words, the ρ, Cp, and k of a site greatly affect the potential profitability of any geothermal system installed in that site.
Disclaimer:
This blog is for educational purposes only. We are researchers with backgrounds in this field, and we are hoping to improve the quality, efficiency, and performance of geo-exchange and geothermal systems everywhere by contributing this science communication openly and freely to the public.